While thinking about how to articulate what “Measure” means for DevOps, I kept having flashbacks to a toy that my son had when he was younger. The toy was a Handy Manny doll which, when his belt buckle was pressed, would utter many useful and life-affirming statements. One of the expressions uttered by Manny is currently playing over and over in my head: “Measure twice, cut once” – Handy Manny

Source: amazon.com
This simple expression captures the essence of measure in DevOps, namely capture and review your metrics/measurements and then take action. In other words, use data to inform and shape our decisions.
Of course, the key to this concept is the data. If you can’t measure, then you don’t know if you’re improving!
Unfortunately, in order to understand the value of measurement, we need to move from the innocence of a kindergarten toy to the military strategy aimed at outmaneuvering the enemy.

Source: wikipedia.org
If the business is war, then we know the enemy – they are your competition. To win the war, we need to adopt a military strategy. Enter the OODA loop.
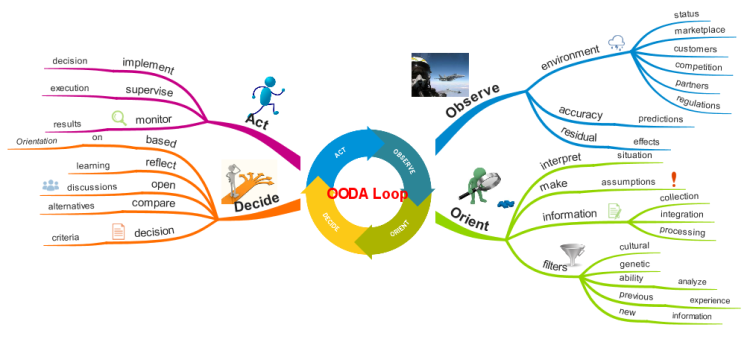
Source: biggerplate.com
The OODA loop is a method for effective decision-making which is composed of a recurring cycle of the following steps: Observe – Orient – Decide – Act. This loop was created by Air Force Colonel John Boyd for application to military tactics in aerial combat. To paraphrase, the objective is to defeat an enemy in combat and survive by operating at a tempo faster than their ability to effectively make their own decisions. An excellent introduction to the subject can be found here.
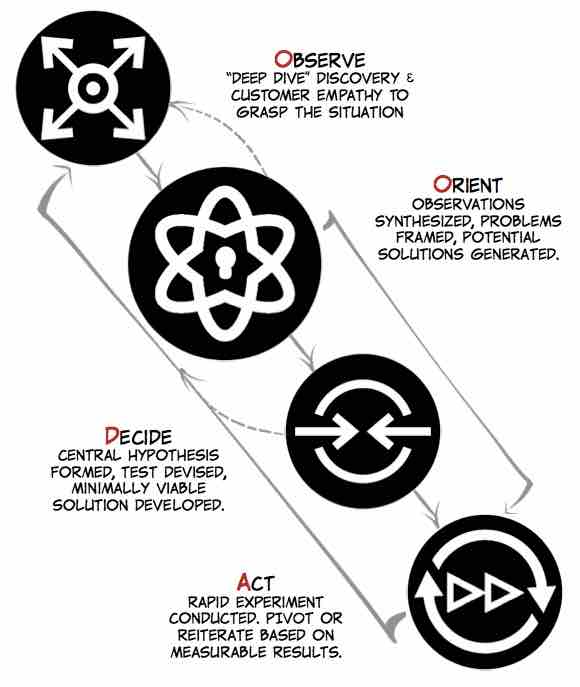
Source: matthewemay.com
This is all great, but how does this apply to software delivery? OODA loops describe the rapid learning cycle of observation, ideation, prototyping and testing that precedes all successful launches. We want faster feature flow into production, higher quality, and more value – so we need to track metrics associated with these outcomes and then use the information to drive feedback loops and decision-making. DevOps has a role in speeding OODA Loops by automating the many numerous touch points that are required in software delivery.
OODA Loops can only move as quickly as their slowest bottleneck allows. By capturing appropriate metrics and events from all levels of the systems, more data can be provided into the OODA loop, allowing for more informed decisions. When one is well informed, the decisions have a tendency to be correct and more precise, as opposed to wild guessing or simply following the Highest Paid Person’s Opinion (HiPPO) in the room.
Logging and Monitoring Strategy
As Axway’s systems evolve to become ever more complex and interdependent in the cloud, having clear visibility of metric and event data is crucial. Metrics provide information related to an applications health and overall performance, while the event data provides clues into the behavioral aspects of our application. Capturing this data is required to improve monitoring, troubleshooting and understanding of the behavior and use of our applications.
Logging is important for debugging and checking up on the general health of your application. If you’re familiar with the 12-factor app, you will know that factor 9, Disposability, states that an app’s processes can be started or stopped at any time; certainly, the case when running in elastic cloud infrastructure or in a container orchestration environment. As a result, we can’t depend on the process or file system being available all of the time (i.e. if the instance has been killed). Therefore, we should follow the guidance in factor 11, Logs, and treat logs as event streams. That is, our applications shouldn’t be concerned with the storage of this information. Instead, these logs should be treated as a continuous stream that is captured and stored by a separate service.
Source: blogs.sas.com
Collect events from everything, everywhere. Collect all the data you can, because the more data you capture, the more visibility you have. For example, collect these when you can: application logs, database logs, network logs, interactions with external systems, configuration files, performance data, usage data, etc. In the past, when I’ve been challenged that excessive logging would have an adverse effect on performance, my initial reaction is that it’s far better to be flying slower than flying blind. Of course, there are various tricks to improve performance (e.g. async logging and having log levels and component-based logging – all of these are available in all modern logging libraries).
The content of log events must contain as much context as possible so that they can be read in isolation. Context of the event includes app id, trace id, tenant id, etc. The format of log events should be in JSON so that it is machine-readable and human-readable. The JSON format is a good choice, as it can be consumed by most modern visibility products:
- Splunk
- Elasticsearch Logstash Kibana (ELK)
- Telegraf InfluxDB Chronograf Kapacitor (TICK)
- NewRelic
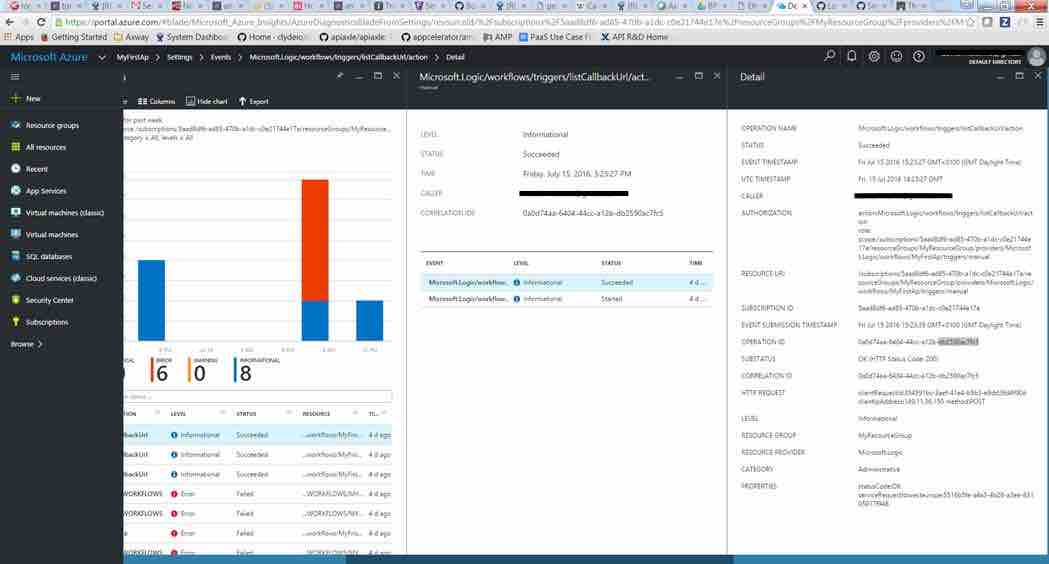
With the modern tooling that is available, much of it openly available, it’s not so scary or daunting when presented to a human:
What to monitor
When teams are continuously deploying (CD) then this is the heartbeat of the project teams, so we must make sure that we have a heart monitor in place so we know the system is alive. There are a number of useful reliability KPIs that can be captured:
- MTTR (Mean Time To Recover/Restore) – Even if we don’t have a Director of Getting Stuff Done, we know that stuff happens, just look at the human errors in production environments. MTTR is the time it takes to recover from a failure scenario.
- Change Fail rate – How often when we push a change to the CD do we fail. As we gain more maturity in DevOps and CD, it’s expected that this metric will drop.
- % of Failed / Successful deployments– A measure of how unsuccessful/successful we are with deployments
- Time in cycle – the time spent in each stage of the CI – CD cycle until the change reaches production. Measuring this will help identify bottlenecks which then become areas for improvement
Conclusion
Adding events and telemetry to the systems that we develop aligns with what we’re doing today with our cloud-connected products. This is pretty trivial given the wealth of modern libraries available today (Logback, Winston, Logrus). Where we face a challenge is that it’s not in our nature to capture everything. For example, how many of our UIs are instrumented, so that we can work out client usage? We need to become more curious and ask for data when we’re making the decision. Once we have the data, we can make more informed decisions on how to change our products; these changes can include removing features, as well as extending and adding features.
Remember: “Measure twice, cut once”
Here are all the blogs in this series:
Follow us on social